In this project I take data from the Centers for Disease Control and Prevention (CDC)
and analyze the data using SQL. The project starts with some simple SQL commands like,
'SELECT', and aggregate functions using 'SUM', 'MAX', ect. Then the data dig moves onto
more advanced skills
such as, 'CAST', inner/outer joins, CTE's, TEMP tables, and creating views.

In this project I use the same dataset from the CDC, and use Tableau to give a more visual representation of the spreadsheet.

Using Pandas, Numpy, Seaborn, and Matplotlib to create, collect, and sort through a movies dataset. I used this data to create corellation maps and scatterplots to find which categories have the highest correlation.
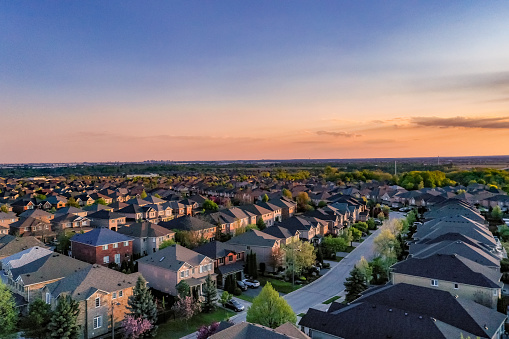
With data cleaning being an integral part of analyzing data, I use SQL to organize and clean the data for housing group in TN.

Creating a small JSON file of the 10 wealthiest people and the utilizing that JSON file in an HTML script to transform it from Javascript strings to JSON for a small query.